Pulse Check Widget – weekly mood check-in for the intranet
5 seconds. One mood. Weekly.
Pulse Check for Staffbase: Weekly mood check-in with 5 levels, live stats from a Data Table and team average – no external survey tools needed.
Overview
The Pulse Check Widget replaces annual employee surveys with a weekly micro-question. A mood check with five mood buttons, done in one click – and the aggregated responses come from a Data Table of the Widget Builder, not from demo data.
Why this widget?
Most engagement surveys have the same problem: too long, too rare, too non-binding. Once a year, 80 questions, no real action – employees don’t feel heard, and HR doesn’t know exactly when the mood tipped.
The Pulse Check Widget makes it shorter, more frequent and visible:
- ✅ One question per week – instead of 80 questions per year
- ✅ Five seconds – instead of half an hour
- ✅ Instantly visible – instead of waiting weeks
- ✅ Anonymous by default – no barrier to honest answers
- ✅ Real aggregation – every vote persists in a Data Table
Architecture
Pulse Check is a textbook example of how the Widget Builder models runtime user data:
| What | Where |
|---|---|
| Branding, question, accent color, theme | Widget settings (editor-time) |
| Which Data Table to talk to | Widget setting tableGuid |
| Incoming votes | Data Table pulse_responses |
| “Has this browser already voted?” | localStorage in the widget JavaScript |
End users cannot change widget settings – that is editor configuration. Votes are therefore written to a Data Table the editor creates once in Staffbase and whose GUID is set on the widget.
Key features
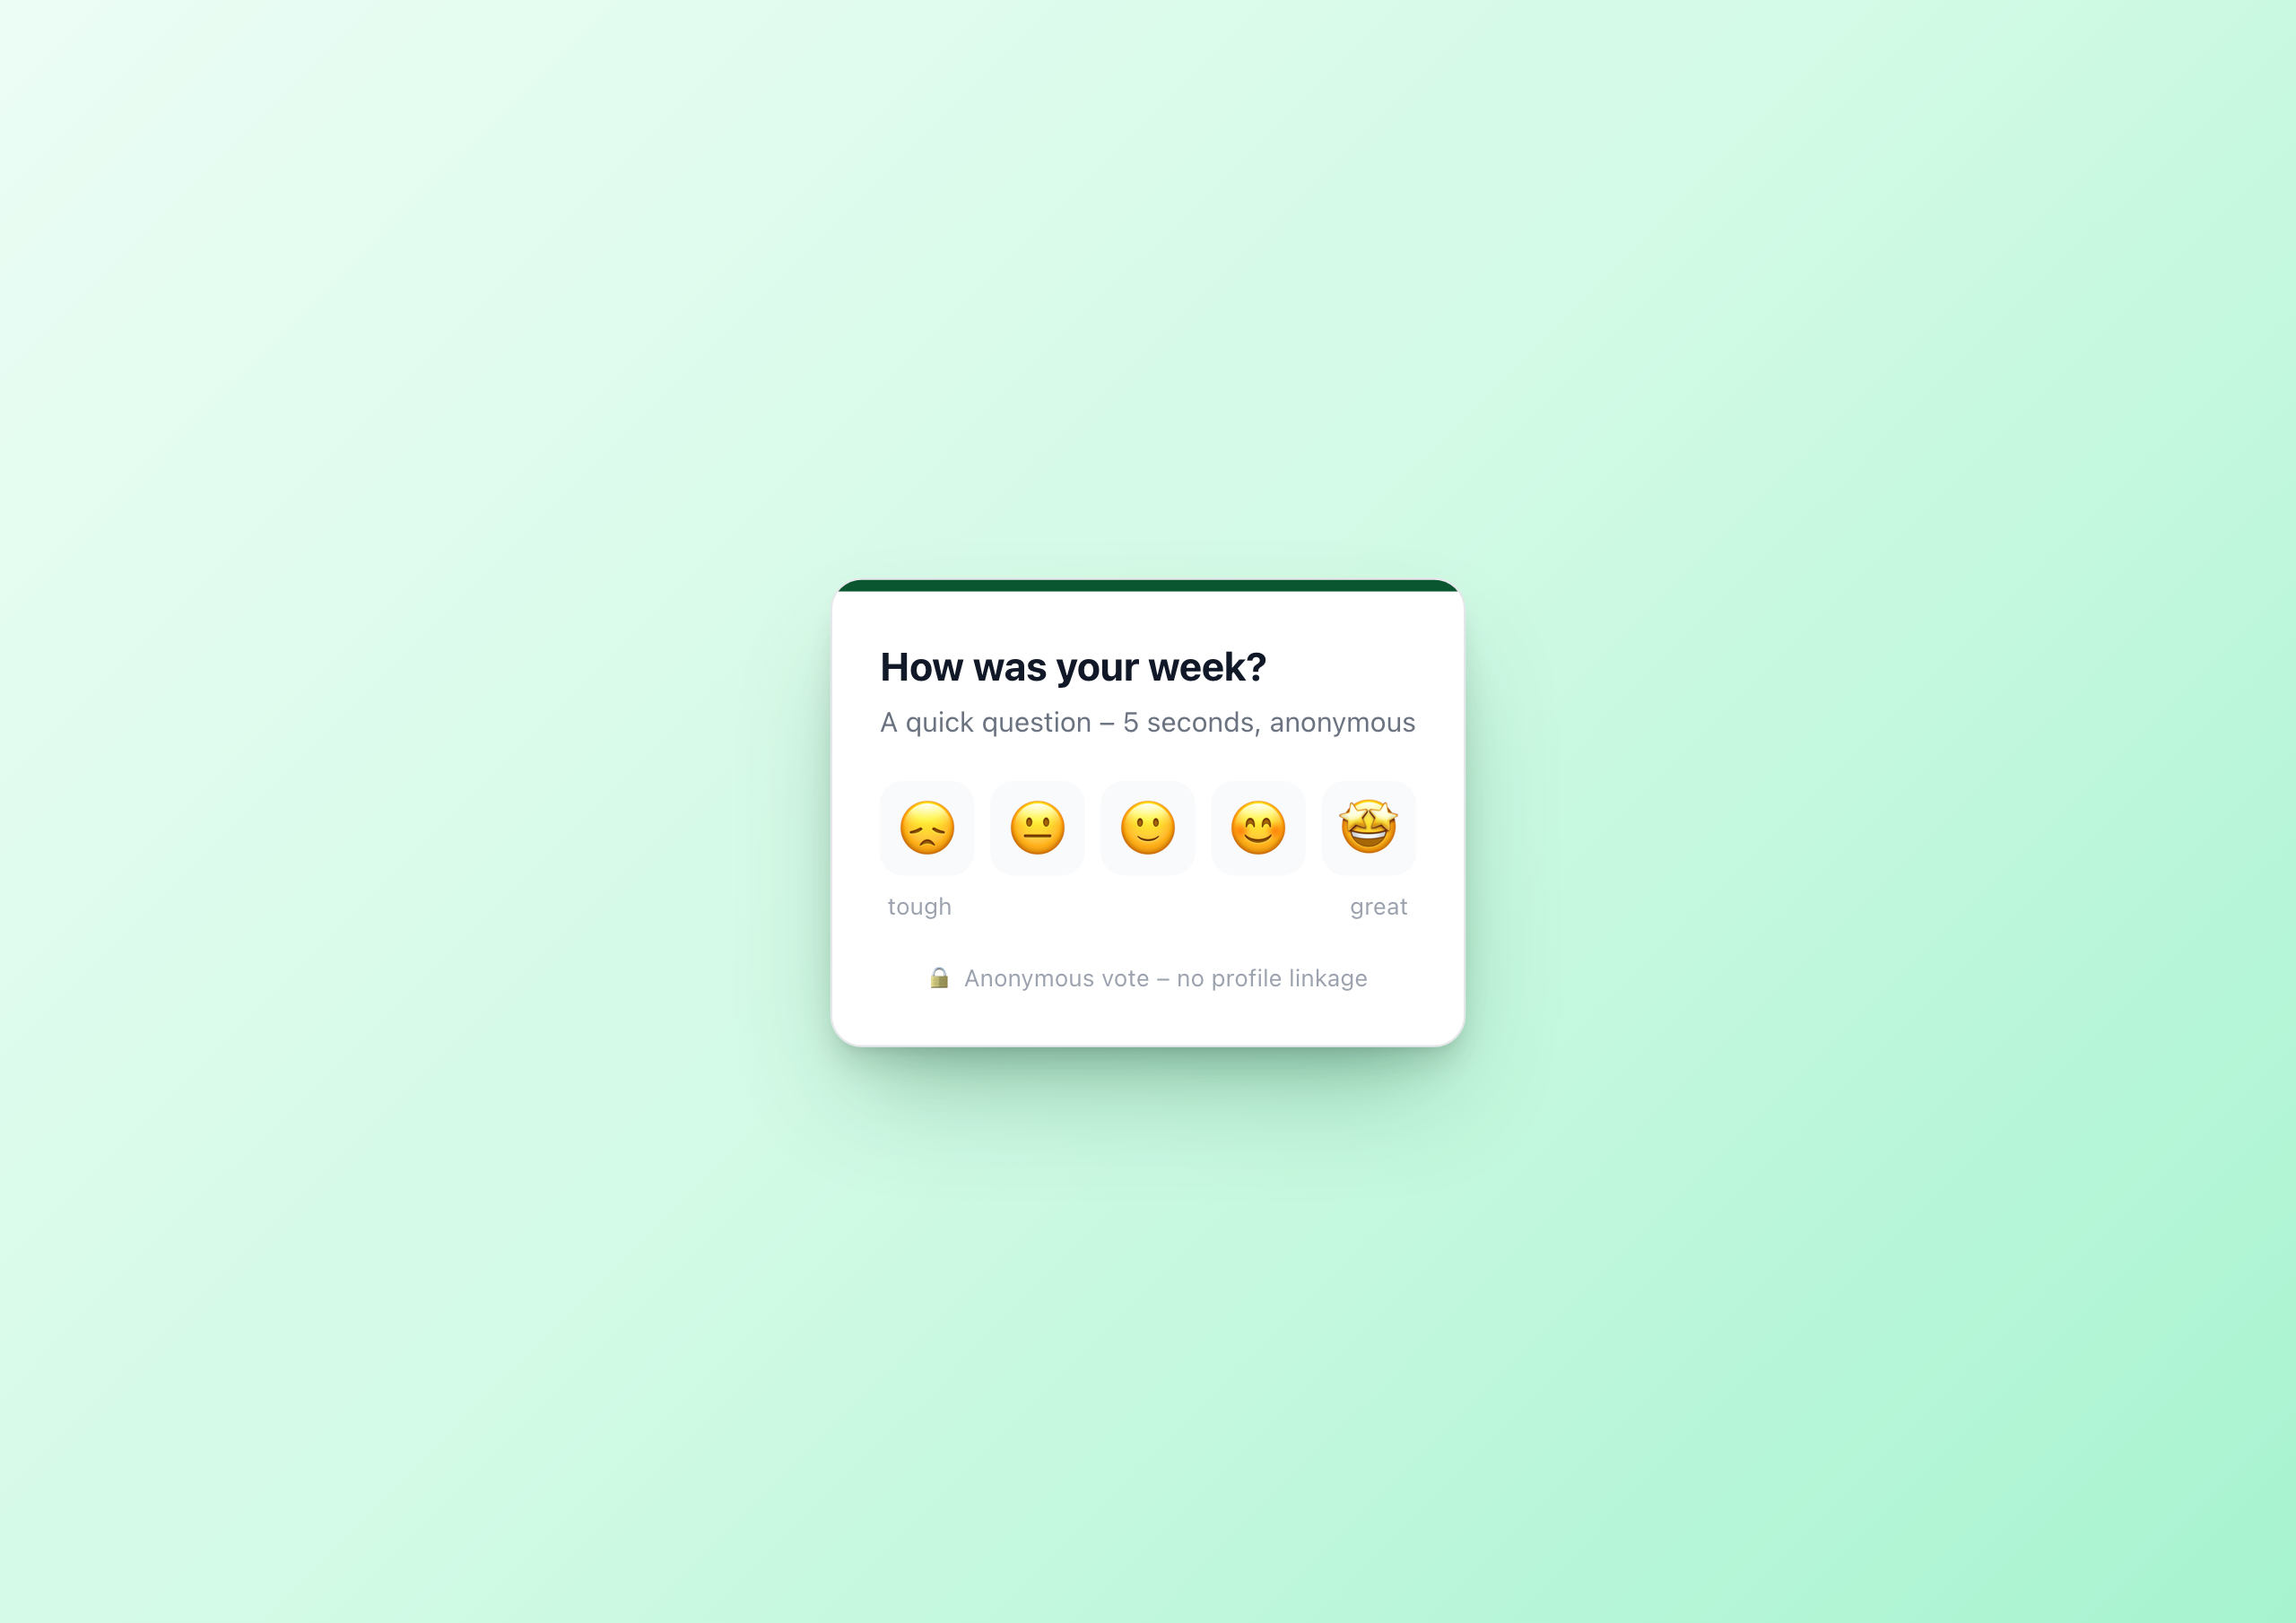
1. 5-level mood scale
Five emoji buttons – from 😞 to 🤩 – as large touch targets. Optimized for mobile use in the Staffbase App. The scale is universally understood and needs no translation.
2. Data Table backend
When a mood button is clicked, the widget POSTs a new row to the Data Table via fetch():
1await fetch('/api/data-table-widget/' + tableGuid + '/rows', {
2  method: 'POST',
3  headers: {'Content-Type': 'application/json'},
4  body: JSON.stringify({
5    data: { mood: parseInt(mood, 10), submitted_at: new Date().toISOString() }
6  })
7});
On every page load, the widget fetches the last 7 days back through the widget API with an OData $filter:
wb://data-table/{{settings.tableGuid}}/rows?$filter=submitted_at ge '{{datetime sub_days=7 to_isodate=true}}'
The datetime helper computes the filter date dynamically – every week the window rolls forward automatically.
3. Stats computed in the browser
The widget receives rows as data.rows. In the template, the array is embedded into a JavaScript constant via {{{json data.rows}}}; the JS counts the mood distribution, computes the average and renders the bars dynamically. No hardcoded demo, no server-side aggregation work.
4. localStorage anti-double-vote
To prevent employees from voting multiple times per week, the widget writes a key pulse_voted_<yyyy-mm-dd> to localStorage after a successful vote. The date is the Monday of the current week, so the lock is scoped per ISO week. On the next page load the widget shows the stats view directly instead of the buttons.
Browser-local means: someone who really wants to vote from a second device can. For honest pulse data that’s fine – a pulse check isn’t an election system, it’s a mood sensor.
5. Anonymity by default
Anonymity is the prerequisite for honest answers. The default columns of the Data Table store no profile field – only mood and timestamp. GDPR-compliant.
If you want responses linked (e.g. for moderated manager pulses in smaller teams), add an optional column team_id or user_email and send it from the JS.
Setup in 5 minutes
- Create a Data Table in the Widget Builder with columns
mood(number 1–5),submitted_at(date) – done - Copy the table GUID from the Widget Builder UI
- Add the Pulse Check widget to a page in the Staffbase editor
- Paste the GUID into the setting “Data Table GUID for pulse responses”
- Pick a question and accent color, publish
Multiple parallel pulses are possible – simply create one table per widget.
Common use cases
📅 Weekly pulse
Put the widget on the homepage every Monday with a new question. “How was your week?” on Friday, “How are you starting the week?” on Monday.
🆕 Onboarding phase
Ask new hires weekly about how they’re doing in their first 30 days – an early warning system for bad onboardings.
🔄 Change support
During major changes (reorgs, tool migrations, office moves) measure mood weekly.
🎯 Team retros
Right before a team retro: a 5-second pulse, the result of which becomes an icebreaker in the retro.
Configuration
8 settings, all editor-time:
- Data Table GUID – required, points to the table for responses
- Question – required, the pulse itself
- Subtitle – short explanation
- Accent color – color picker
- Theme – light or dark
- Stats after voting – show/hide
- Team average – show/hide
- Anonymous – show/hide hint text
Technical
- Platform: Staffbase 5.0+
- Multilingual: German and English out of the box
- Responsive: Mobile-first, large touch targets
- Performance: < 500 ms initial render
- Data model: Data Table with
mood(1–5) andsubmitted_at - Anti-double-vote:
localStoragebrowser-local
Connect External Systems
The Pulse Check works standalone with the built-in Data Table — but you can also pull sentiment data from your existing engagement platform.
- Culture Amp – Visualize pulse survey results from Culture Amp directly in the intranet
- Peakon (Workday) – Automatically import engagement scores from Peakon into the widget
- Officevibe – Display real-time mood data from Officevibe on the homepage
- Qualtrics – Surface sentiment data from Qualtrics surveys in the intranet
FAQ
Can employees vote multiple times?
Per browser per week only once – enforced via localStorage. The key contains the date of the week’s Monday, so every new week a vote is possible again. Someone who actively wants to vote from a second device can. For honest pulse data, that’s enough.
How are stats produced?
From the Data Table. The widget API pulls all rows of the last 7 days via an OData $filter and the embedded JavaScript computes counts and average in the browser.
Can I run more than one pulse in parallel?
Yes. Each pulse is its own Data Table and its own widget instance with its own tableGuid. So you can run a global Friday pulse and parallel an onboarding pulse for new hires.
Is the widget GDPR-compliant?
Yes. The default columns store no profile field – only mood and timestamp. Legally safe in the EU.
Screenshots
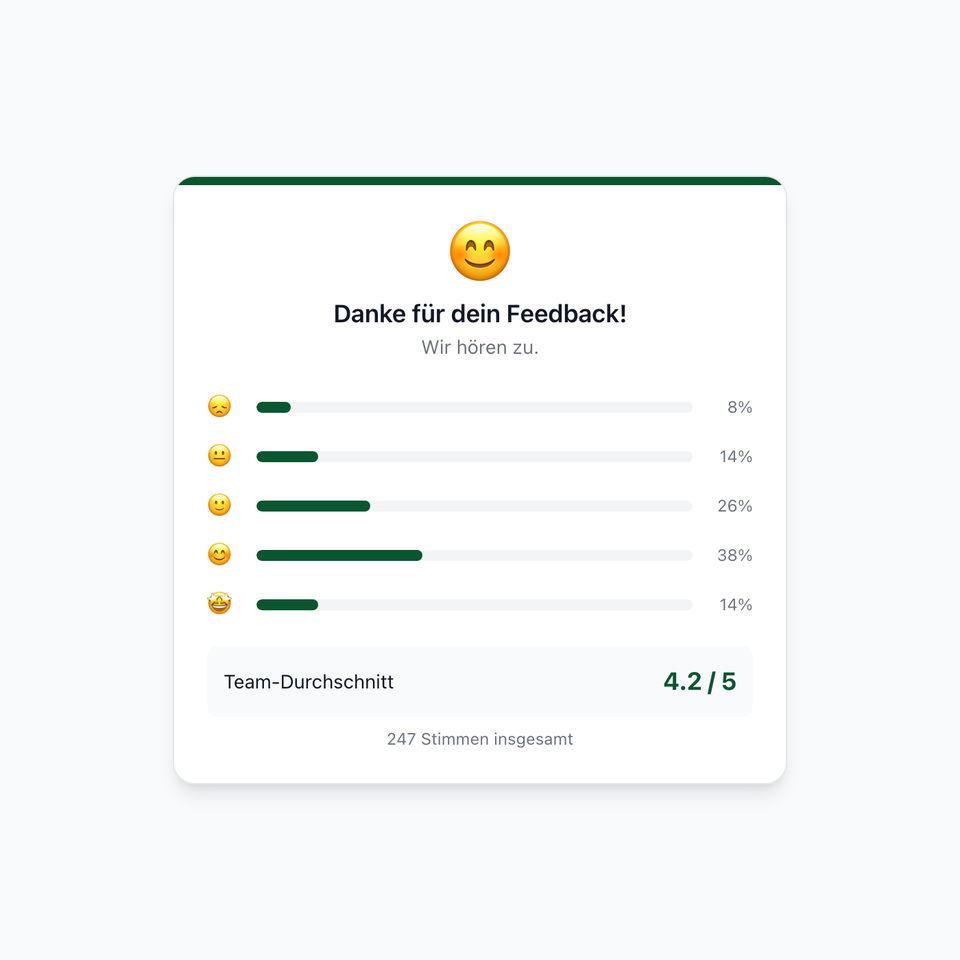
Post-vote: 5 mood bars, team average and total votes from the Data Table
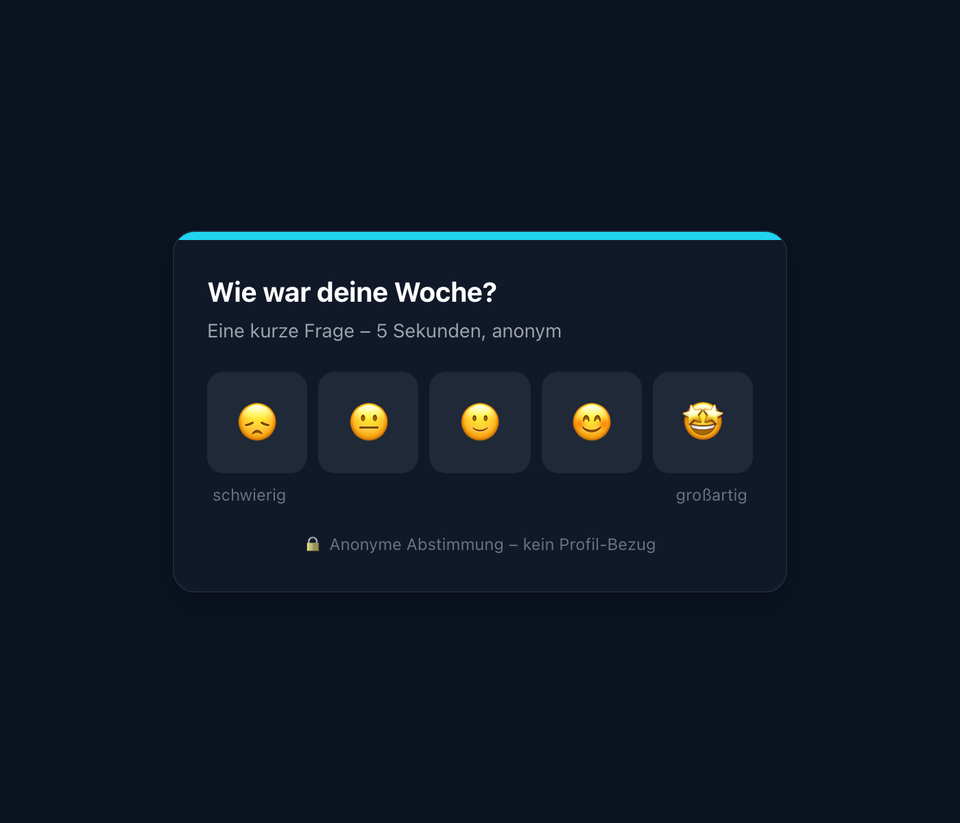
Dark mode with cyan accent – ideal for dark page templates
The screenshots shown are example views with generated demo data. Customers adapt the widgets to their own systems and corporate design.
Use Cases
Weekly pulse
One question every Friday – make trends visible across weeks
Onboarding phase
How are new hires doing in their first 30 days?
Change support
Measure mood during major change without creating barriers
Team retros
Quick mood check before every retrospective
Key Features
- 5-level mood scaleFrom 😞 to 🤩 – large touch targets for mobile use
- Data Table backendEvery vote is stored as a row. Stats are aggregated server-side from the table.
- Weekly rolling windowOData `$filter` with `submitted_at ge` shows only the last 7 days
- localStorage anti-double-voteBrowser-local voting memo prevents multiple votes per week
- MultilingualGerman and English out of the box
- Light & dark modeBoth themes with configurable accent color
Integrations
Questions about the Pulse Check Widget – weekly mood check-in for the intranet?
Our team is happy to help you personally