Annual employee surveys don’t work. 80 questions, 30 minutes of effort, three weeks waiting for the analysis – and in the end, employees don’t read the results HR publishes in a SharePoint PDF anyway. Asking once a year doesn’t make people feel heard. Answering once a year leads to imprecise or no answers.
The Pulse Check Widget flips the equation: one question per week, five seconds of effort, instantly visible result. No external survey tool, no separate login page, no HR email saying “please take 30 minutes”. Just one widget on the intranet homepage with five emoji buttons – and a Data Table as the backend for responses.
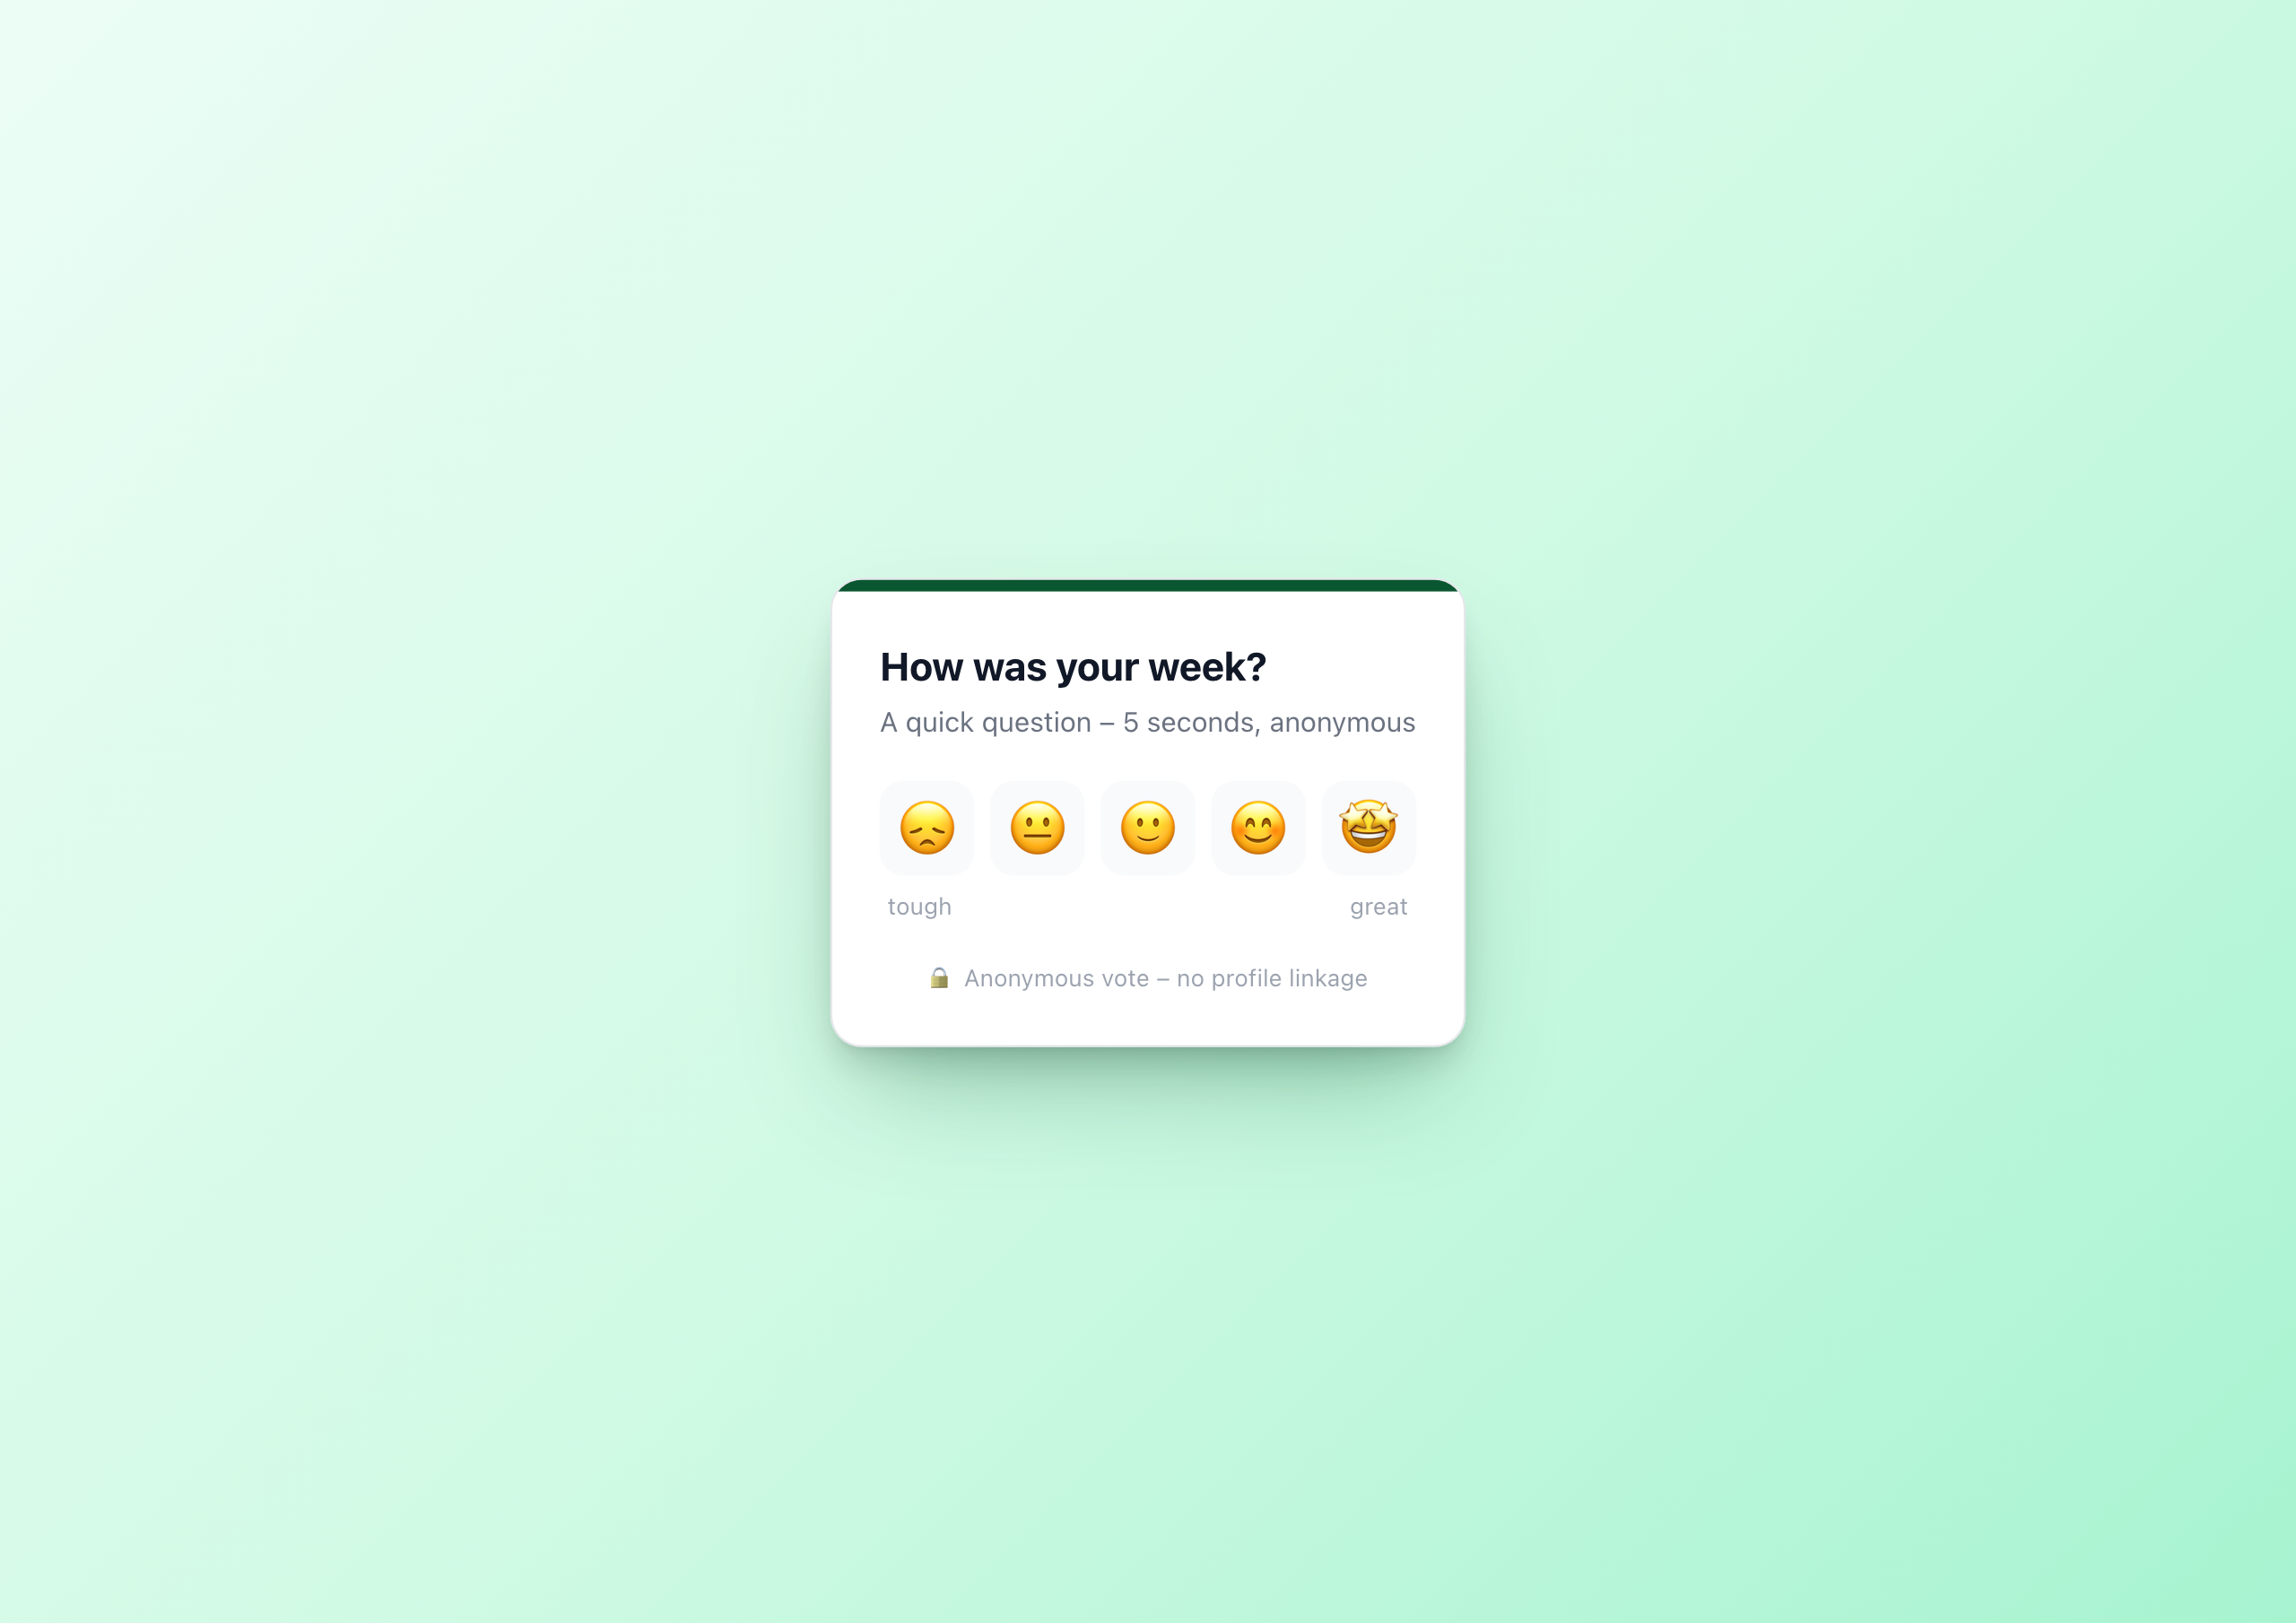
Five seconds, five buttons
The employee sees a question – “How was your week?” – and five mood buttons from 😞 to 🤩. One click. Done. The widget instantly shows the aggregated responses of the last 7 days: how the team feels, where the average is, how many have voted.
For the individual it’s a 5-second touchpoint. For HR and IC it’s a weekly mood heatmap across all locations and teams.
Why Data Tables instead of settings
An important architecture decision up front: widget settings are editor configuration, not runtime user data. A pulse check that simply uses setVariable('has_voted','1') doesn’t work – end users can’t persistently change widget variables, and there is no aggregation across users.
The clean way in the Widget Builder is a Data Table:
- Create a table
pulse_responsesin the Widget Builder with columnsmood(number 1–5) andsubmitted_at(date) - Copy the table GUID
- Paste it into the widget editor setting “Data Table GUID for pulse responses”
That’s it. From now on every vote lands as a row in the table, every page load reads the last 7 days and builds the stats from it.
The widget API: OData with Handlebars
The widget has an API URL that the Widget Builder calls on render:
wb://data-table/{{settings.tableGuid}}/rows?$filter=submitted_at ge '{{datetime sub_days=7 to_isodate=true}}'
Two important things happen here:
{{settings.tableGuid}}– the table GUID comes from the editor setting. Want to run multiple pulses in parallel? Simply create one table per widget.{{datetime sub_days=7 to_isodate=true}}– thedatetimehelper computes the filter date dynamically. “7 days ago” is resolved at render time, the window rolls forward every week automatically.
The useProxy: true flag tells the Widget Builder to resolve the wb:// URL server-side and inject the table data as data.rows into the template.
Submit via fetch(), stats via JavaScript
When a mood button is clicked, the widget makes a POST to the Data Table endpoint:
 1btn.addEventListener('click', async function(){
 2  var mood = btn.getAttribute('data-mood');
 3  var tableGuid = '{{settings.tableGuid}}';
 4  await fetch('/api/data-table-widget/' + tableGuid + '/rows', {
 5    method: 'POST',
 6    headers: {'Content-Type': 'application/json'},
 7    body: JSON.stringify({
 8      data: { mood: parseInt(mood, 10), submitted_at: new Date().toISOString() }
 9    })
10  });
11  var d = new Date();
12  d.setDate(d.getDate() - ((d.getDay() + 6) % 7));
13  var weekKey = d.getFullYear() + '-' +
14    String(d.getMonth() + 1).padStart(2, '0') + '-' +
15    String(d.getDate()).padStart(2, '0');
16  localStorage.setItem('pulse_voted_' + weekKey, mood);
17  showStats(mood);
18});
Three things happen in parallel:
- POST to the Data Table – the vote lands in the table immediately
- localStorage entry – a key
pulse_voted_<yyyy-mm-dd>(the Monday of the current week) marks “this browser has already voted this week” showStats(mood)– the widget switches from the vote view to the stats view, no page reload
On the next page load, the widget checks the localStorage key – if it’s set, the widget shows the stats view directly instead of the buttons.
Stats are computed in the browser
The aggregation runs client-side because that’s the simplest path. The template embeds the rows as a JavaScript constant:
 1<script>
 2  var rows = {{{json data.rows}}} || [];
 3  var counts = [0,0,0,0,0];
 4  var sum = 0;
 5  rows.forEach(function(r){
 6    var m = parseInt(r.mood, 10);
 7    if (m >= 1 && m <= 5) { counts[m-1]++; sum += m; }
 8  });
 9  var total = rows.length;
10  var avg = total ? (sum/total).toFixed(1) : '0.0';
11  // …set bars and average in the stats DOM
12</script>
No server-side aggregation work, no extra API. The {{{json data.rows}}} is the trick: the json helper serializes the data as a JSON literal directly into the script tag.
Anti-double-vote via localStorage
Employees should not be able to vote multiple times per week. After a successful vote, the widget writes a pulse_voted_<yyyy-mm-dd> key to the browser’s localStorage – the date is the Monday of the current week, so the lock is scoped per ISO week. On the next render the widget checks:
1var d = new Date();
2d.setDate(d.getDate() - ((d.getDay() + 6) % 7));
3var weekKey = 'pulse_voted_' + d.getFullYear() + '-' +
4  String(d.getMonth() + 1).padStart(2, '0') + '-' +
5  String(d.getDate()).padStart(2, '0');
6var storedMood = localStorage.getItem(weekKey);
7if (storedMood) showStats(storedMood);
Browser-local means: someone who really wants to vote from a second device can. For honest pulse data that’s fine – a pulse check isn’t an election system, it’s a mood sensor. If you want to enforce harder, you can add a user-specific filter on the table (column user_email, with eq filter at render time).
Anonymity by default
The default columns of the table store no profile field – only mood and timestamp. That is GDPR-compliant and legally safe even in delicate phases (reorgs, layoffs, conflict situations).
If you want responses linked – e.g. for moderated manager pulses in smaller teams – you can add a team_id column and send it from the JS via a second widget setting. But anonymity stays the default.
When to use this widget
- Weekly Friday Pulse – “How was your week?” every Friday at 2 PM
- Onboarding phase – ask new hires weekly during their first 30 days
- Change support – feel the pulse during reorgs, tool migrations, office moves
- Team retro prep – a 5-second pulse before every retro
- CEO Connect prep – measure mood before a town hall to prioritize topics
Try it in the gallery
You can see the live demo, all settings and the setup steps for the Data Table in the Pulse Check gallery entry .
Related widgets
- Poll Widget – for longer surveys with multiple choice
- Town Hall Live Hub – to present pulse results in the town hall
- Charts & Dashboards – to visualize pulse trends as a time series