OKR programs rarely fail because of methodology. They fail because of visibility. The strategy team knows the goals. Management knows the goals. But the team member in sales, manufacturing, customer service sees the OKRs at most at the quarterly kickoff – and forgets them two weeks later.
Whoever doesn’t know what the team is working toward can’t tell where their contribution fits. Whoever doesn’t see that their own OKR is “at risk” doesn’t react. Whoever achieved an OKR and nobody noticed feels invisible.
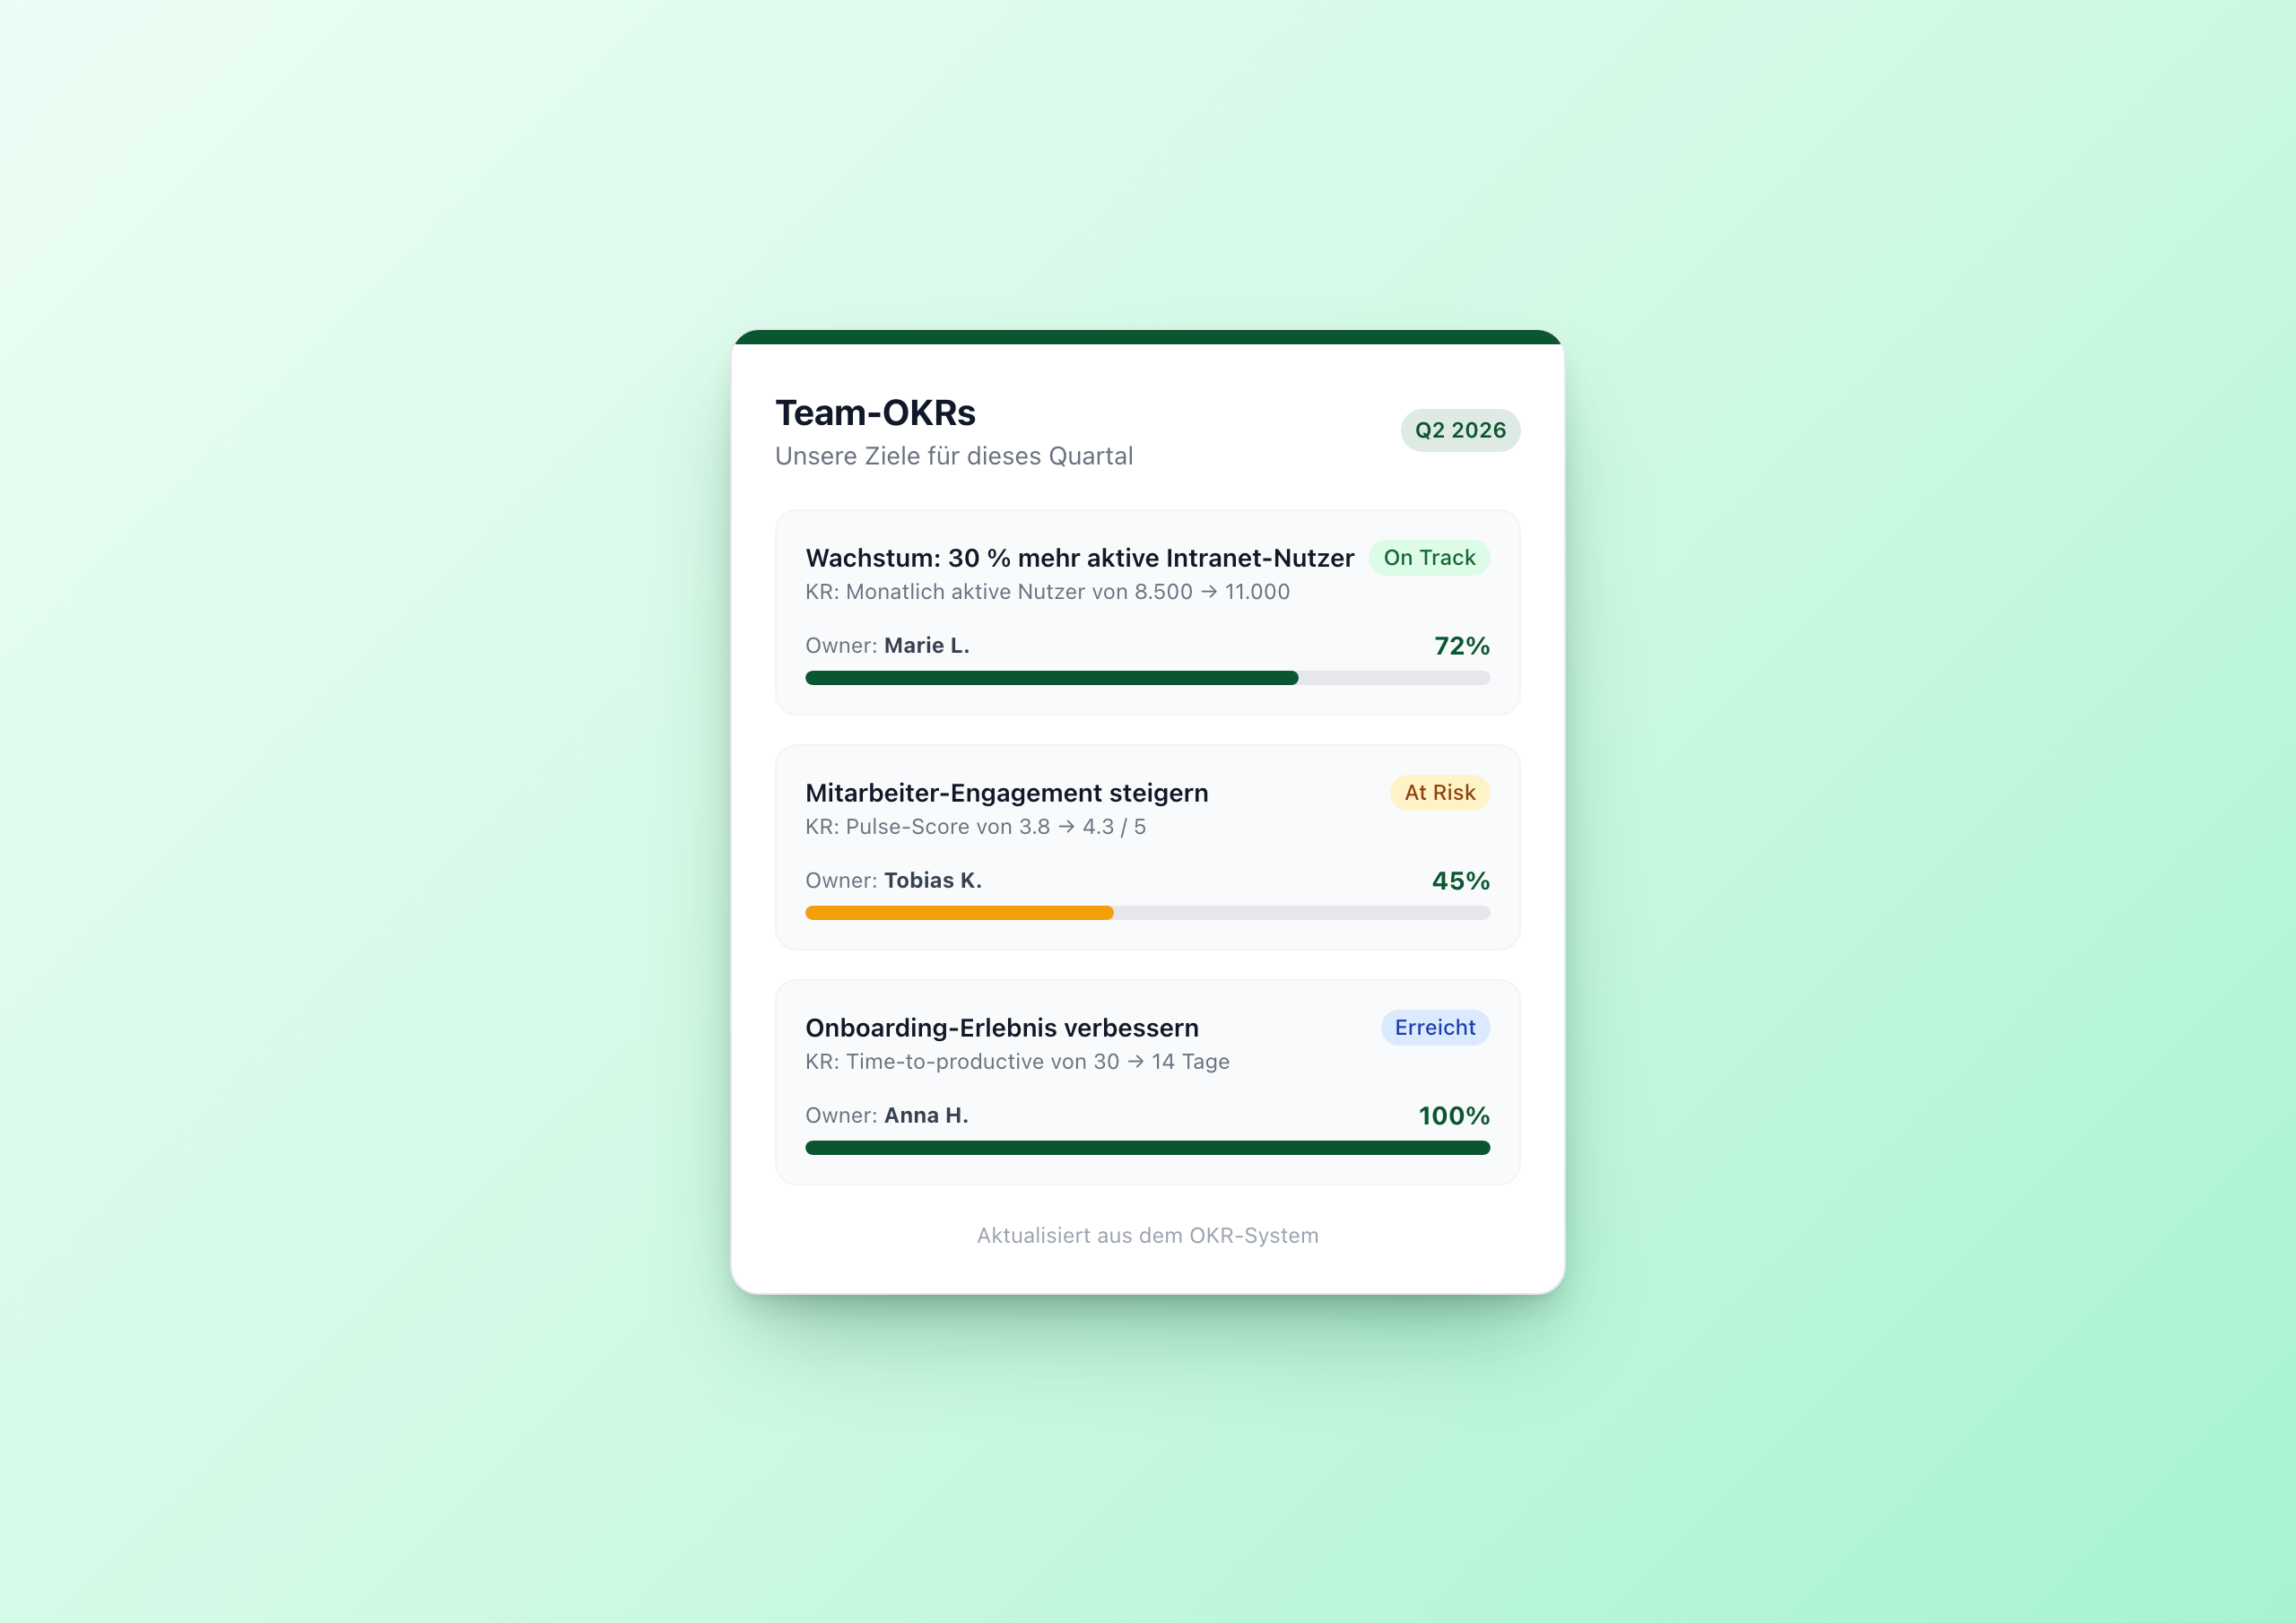
The OKR Tracker Widget fixes this with a single means: the OKRs are on the intranet homepage.
Three design decisions
1. No submit form. Unlike Kudos Wall or Idea Box , this widget intentionally has no user input. OKRs aren’t submitted by random employees – they’re maintained by the strategy team. The widget reads from the Data Table but doesn’t write to it.
2. Progress as a number column. 0 to 100, simple. In the template, the value is used directly as a CSS width percentage: style="width: {{this.progress}}%". No calculation, no helper, no state – just a number the strategy team updates weekly.
3. Status decides the bar color. Status isn’t just a badge. Status also colors the progress bar – green for on_track, amber for at_risk, red for off_track. That goes via a nested Handlebars conditional in the inline style:
1<div class="h-full rounded-full" style="width: {{this.progress}}%;
2  background-color:
3    {{#if (eq this.status 'off_track')}}#dc2626{{else}}
4    {{#if (eq this.status 'at_risk')}}#f59e0b{{else}}
5    {{../settings.accent_color}}
6    {{/if}}{{/if}};">
7</div>
Hard conditional, but the effect is instantly readable. A red bar among all green ones says: “nobody is taking care of this right now”.
Architecture: Data Table again
Six columns in the Data Table:
| Column | Type |
|---|---|
objective | text |
key_result | text |
owner | text |
progress | number 0–100 |
status | text |
submitted_at | date |
The widget API reads sorted by progress desc – the most ambitious OKRs first. That’s a deliberate choice: whoever is at 100% is the success story; whoever is at 5% needs help. Both belong at the top.
Who maintains the Data Table?
Three ways work:
- Manual maintenance – the strategy team updates status and progress weekly in the table. Works for 5–15 OKRs.
- Sync script – a small backend script pulls OKR data from Lattice, Workday or another tool and writes it via Data Table API to Staffbase. Works for 50+ OKRs.
- BI binding – progress values come automatically from a KPI system (Power BI, Looker, …) – when the KPI is done, it moves as “Done” into the tracker.
All three ways write to the same Data Table. The widget doesn’t need to know about any of it.
When to use this widget
- Quarterly kickoff – instead of PowerPoint, put the slide on the intranet homepage once
- Reporting to employees – weekly updates without a new email newsletter
- Strategy rollout – company OKRs visible, not hidden in the strategy wiki
- Team pages – per team an own page with own goals, own Data Table
Try it in the gallery
Setup steps and all 7 settings are in the OKR Tracker gallery entry .
Related widgets
- Charts & Dashboards – for detailed KPI visualization
- Kudos Wall – to celebrate OKR successes immediately
- Idea Box – for employee suggestions with status workflow